
Test Behavior, Not Choreography
Part 5 of Getting Started with Mocks: a test that pinned the retry schedule broke on a change no customer could notice. Here is how to rewrite it.
Co-founder and CTO of Speedscale, expert in Agentic AI and cloud data warehousing. • 9 posts published
Part 5 of Getting Started with Mocks: a test that pinned the retry schedule broke on a change no customer could notice. Here is how to rewrite it.

Part 6 of Getting Started with Mocks: stub, spy, fake, mock, and dummy, sorted by what each one does. Java, Node, Go, Python.
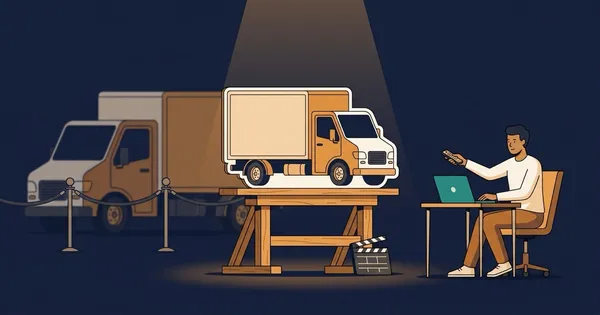
Part 1 of Getting Started with Mocks: the one job a mock does, the five situations where you need one, and what a green mocked test does not prove.
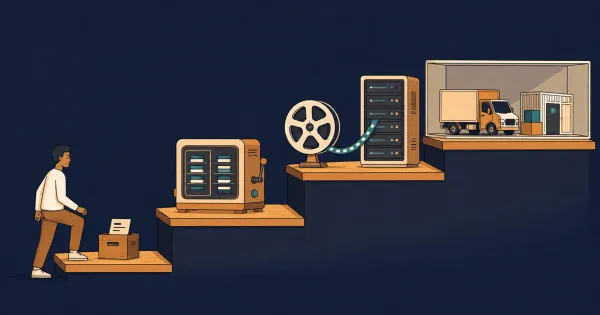
Part 9 of Getting Started with Mocks: a decision framework for stubs, fakes, fake servers, mock servers, record-and-replay, and real dependencies.
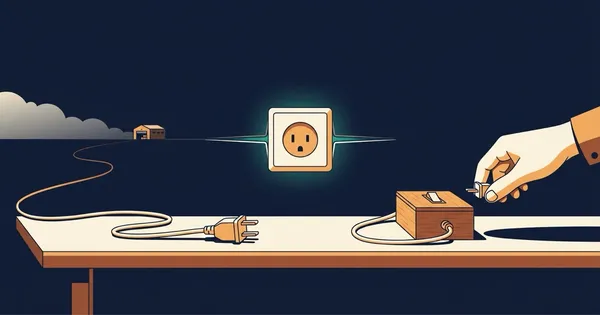
Part 2 of Getting Started with Mocks: a test you cannot write, one seam, and the smallest mock that makes a delayed package happen. Java, Node, Go, Python.
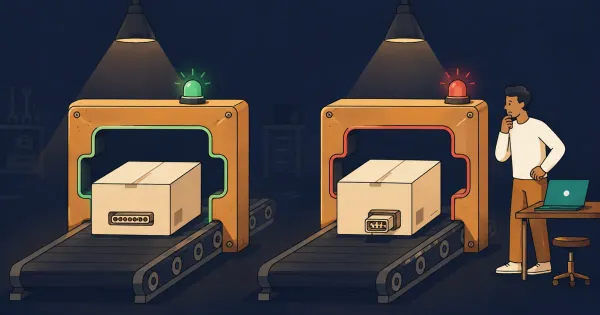
Part 8 of Getting Started with Mocks: the carrier renames a field, production breaks, and every mocked test still passes. Java, Node, Go, Python.

Security controls rarely break a banking platform alone. Their cumulative divergence from Kubernetes standards creates a compounding maintenance tax.

A scoped chaos rule takes one dependency down and nothing else, so the fallback branch in your code executes on demand instead of during an outage.
Scoped chaos rules are now in proxymock: pick traffic with a filter query, perturb it, and label every injected failure so it is never mistaken for a real one.
Choose the desktop proxymock or the hosted cloud trial to get started.