





No Kubernetes required
proxymock runs on your laptop against a local process. No cluster, no operator, no sidecar. The same recordings run in CI when you are ready.
Your service already produces the best test data you will ever have. Capture it, run without your dependencies, and see exactly what your change broke.
brew install speedscale/tap/proxymock
Also available via curl, and for Java, .NET, Node.js, Go, and Python.
proxymock record --app-port 8080capturing on :8080 -> 4919 requests
POST /api/checkout 1204
GET /api/cart/{id} 892
postgres://orders 2823
written to ./proxymock/recordedproxymock mock --in-dir ./proxymock/recordedmock server listening on :4143
postgres://orders matched
https://api.stripe.com matched
https://auth.internal matched
no live dependencies requiredproxymock replay --in-dir ./proxymock/recorded \
--test-against http://localhost:80804919 requests replayed
4917 identical
2 changed
POST /api/checkout
- "tax": 4.20
+ "tax": 4.2000000001That last diff is a real regression. Nobody wrote an assertion to catch it.










Promote a local recording into a CI job and every pull request replays real traffic before merge.
Response diffs are computed against what production actually returned, so there are no assertions to write or maintain.
Sensitive fields are masked at capture time, so recordings are safe to commit and share.
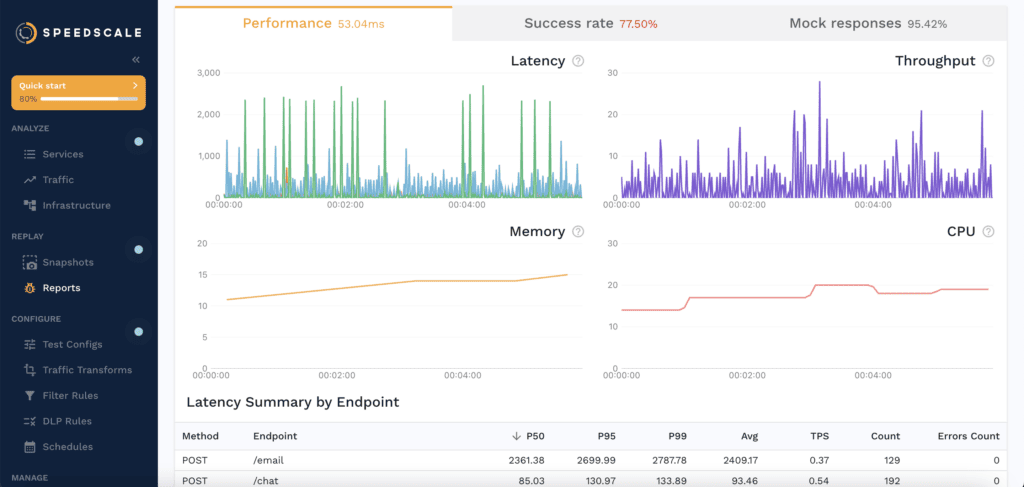
Latency is reported per endpoint at P50 through P99, so performance regressions surface in the same run.
Real traffic, captured once, reused everywhere.
proxymock runs on your laptop against a local process. No cluster, no operator, no sidecar. The same recordings run in CI when you are ready.
Postgres, MySQL, Redis, and gRPC are captured and mocked at the protocol level, so the dependencies your service actually talks to are covered.
Replay compares every response against what production actually returned. You do not write the assertions, and you do not maintain them.
Coding agents get a deterministic environment and a pass/fail signal from real traffic, instead of grading their own work against tests they wrote.
Install proxymock and get to a first record, mock, or replay in about ten minutes.
Capture production traffic, turn dependencies into mocks, and replay every change before it reaches production. Your coding agent gets an independent check based on how the service actually behaves.
Agent change #184
checkout-service
Requests
4,919
Identical
4,917
Changed
2
response status
expected: 200 OK
actual: 500 Internal Server Error
Capture real application behavior once, then reuse it across development, CI, debugging, and performance testing.
The quality loop
One captured snapshot becomes the repeatable environment and the expected behavior. The agent can keep working until the replay passes.
Record the requests, responses, protocols, and timing your service already handles.
Turn downstream APIs and databases into protocol-aware mocks your agent can run anywhere.
Run the same production-shaped traffic against the new build in local development or CI.
Compare behavior and latency, fix what changed, and rerun the exact same verification.
One replay, four checks
Production traffic supplies the inputs, dependency behavior, and expected responses. Speedscale turns that context into a check your team can rerun after every code change.
Run the loop locally with proxymockResponse bodies, status codes, and schemas compared with captured production behavior.
P50 through P99 latency measured per service and endpoint during the same replay.
HTTP, gRPC, Postgres, MySQL, and Redis available without a shared test environment.
A repeatable CI result based on traffic the application actually served.
Start locally with proxymock, or connect a Kubernetes service and replay traffic at scale.