Test PostgreSQL With the Queries Your App Actually Runs
Install proxymock with your coding agent
Before you start, paste this into Claude Code, Cursor, Codex, Gemini CLI, Kiro, or any assistant that can read a URL and run commands:
Install proxymock for me on this machine. First fetch the agent skill at
https://raw.githubusercontent.com/speedscale/skills/main/skills/install-speedscale/SKILL.md
and the references/ and scripts/ files it links to (same base URL), save them
under your skills directory, then follow the skill in local mode: proxymock and
its MCP server only, no Kubernetes operator.
The install-speedscale skill installs proxymock for your operating system and walks you through proxymock init. It stops when you need to complete browser sign-in, keeps your recordings on your machine, and connects the proxymock MCP server so your assistant can run the prompts later in this article.
The first number from my local PostgreSQL 16 test was 18,756 statements per second. It looked impressive. It was also the least useful result in the run.
The useful part was the workload. It came from queries the demo app had actually sent: the same prepared statements, parameters, reads and writes. A synthetic benchmark tells you how PostgreSQL handles a synthetic workload. It does not tell you whether your migration just broke the UPDATE your app depends on.
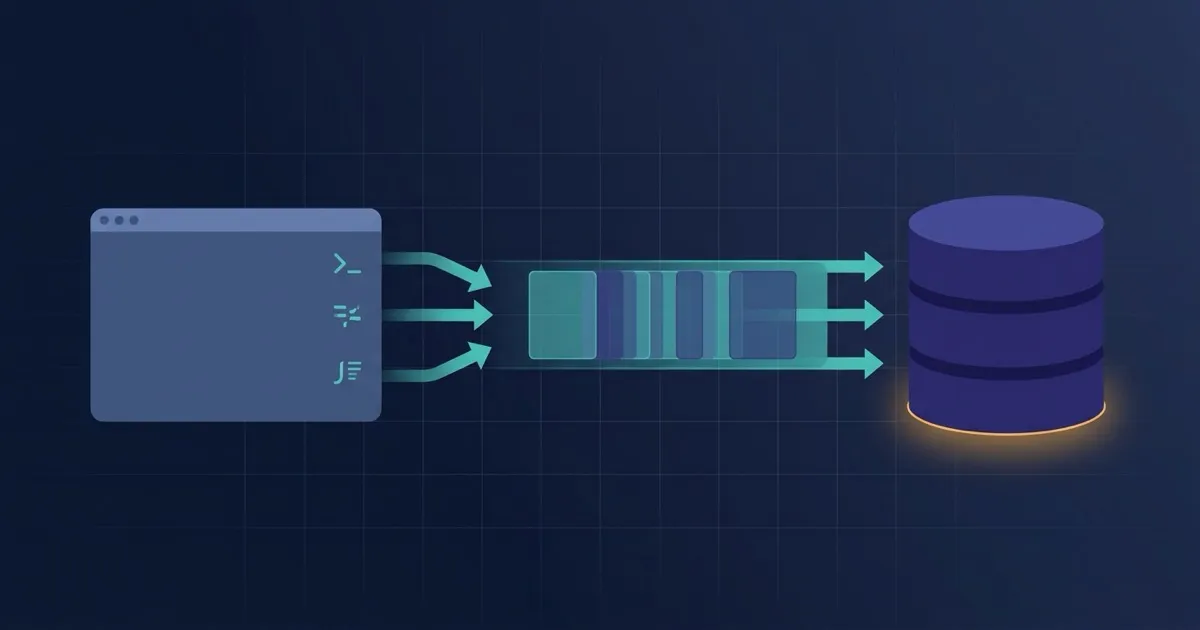
That workload was already sitting in a proxymock recording. The recording can mock the database, drive load against a real one, or replay once against a migrated schema to show exactly which statements broke. I use it for three related jobs, with either an AI coding assistant or the equivalent proxymock command:
- A quick mock check: record, run the app against a mocked database, and replay the app’s own traffic.
- A database regression test: replay the recorded queries once against a new schema or PostgreSQL version.
- A database load test: replay the recorded queries with many concurrent sessions.
flowchart LR
    A[Your app] -->|real queries| R[proxymock recording]
    R --> M[Mock check<br/>no database needed]
    R --> G[Regression test<br/>new schema or version]
    R --> L[Load test<br/>many sessions]
Run the copy/paste PostgreSQL demo
Here is the exact demo behind this post. You need Docker, Go 1.19 or newer, Git, curl and proxymock installed and initialized once. The commands create a disposable PostgreSQL 16 container that accepts local connections without a password, so there are no credentials to invent or placeholders to replace. Do not use that authentication setting for anything except this local demo.
Start in a new terminal:
DEMO_DIR="$(mktemp -d /tmp/proxymock-postgres-demo.XXXXXX)"
git clone https://github.com/speedscale/demo.git "$DEMO_DIR"
printf '%s\n' "$DEMO_DIR" > /tmp/proxymock-postgres-demo.path
cd "$DEMO_DIR/go-postgres"

docker rm -f proxymock-postgres-howto >/dev/null 2>&1 || true
docker run --name proxymock-postgres-howto \
  -e POSTGRES_HOST_AUTH_METHOD=trust \
  -e POSTGRES_DB=tasks_db \
  -p 5432:5432 \
  -d postgres:16

until docker exec proxymock-postgres-howto pg_isready -U postgres >/dev/null 2>&1; do sleep 1; done
The setup saves the temporary checkout path in /tmp/proxymock-postgres-demo.path, so the commands for each new terminal can find it without a placeholder. When I validated this sequence, the recording contained five HTTP requests and 37 PostgreSQL protocol frames.
1. Record the app and its real queries
In terminal 1, start proxymock. Port 15432 is the database proxy; port 4143 is where you send HTTP traffic for the app that normally listens on 8080.
proxymock record --map 15432=localhost:5432 --app-port 8080In terminal 2, start the demo app through the database proxy:
cd "$(cat /tmp/proxymock-postgres-demo.path)/go-postgres"
PGUSER=postgres PGPORT=15432 go run .
In terminal 3, copy and paste this representative session:
cd "$(cat /tmp/proxymock-postgres-demo.path)/go-postgres"

curl http://localhost:4143/users

curl -X POST http://localhost:4143/users \
  -H 'Content-Type: application/json' \
  -d '{"first_name":"Test","last_name":"User","email":"howto@example.com","username":"howtouser","age":31,"phone":"555-0100","address":"1 Demo Way","city":"Austin","country":"USA","job_title":"Engineer","department":"Engineering","salary":90000,"hire_date":"2024-01-15T00:00:00Z","is_active":true}'

curl -X PUT http://localhost:4143/users/1 \
  -H 'Content-Type: application/json' \
  -d '{"first_name":"Updated","last_name":"User","email":"updated-howto@example.com","username":"updatedhowto","age":32,"phone":"555-0101","address":"2 Demo Way","city":"Boston","country":"USA","job_title":"Staff Engineer","department":"Engineering","salary":110000,"hire_date":"2024-02-15T00:00:00Z","is_active":true}'

curl -X DELETE http://localhost:4143/users/2
curl http://localhost:4143/users
Stop the recorder and app with Ctrl+C after the requests finish. The new proxymock/recorded-* directory contains both sides of the session: the inbound HTTP calls and the outbound PostgreSQL exchanges they caused.
Prefer an AI assistant? Copy this prompt into one with the proxymock MCP server installed:
Use proxymock to record my application's inbound HTTP traffic and its outbound PostgreSQL traffic. I am in the speedscale/demo go-postgres directory. PostgreSQL is running at localhost:5432 with user postgres and no password. The app listens on port 8080. Map local port 15432 to PostgreSQL, start the recorder, and start the app with PGUSER=postgres and PGPORT=15432. When the app is ready, send these requests through http://localhost:4143: GET /users; POST /users with a complete valid user; PUT /users/1 with a complete valid user; DELETE /users/2; and GET /users again. Wait for every request, stop the recorder and app cleanly, then report the recording directory plus the HTTP and PostgreSQL RRPair counts.2. Prove the app works without PostgreSQL
This is my “get some traffic and make sure the plumbing works” path. Stop your local PostgreSQL, run the app against the mock, and replay the app’s inbound traffic at it.
Stop the disposable database, then start the mock and app together in terminal 1:
docker stop proxymock-postgres-howto
PGUSER=postgres proxymock mock -- go run .
In terminal 2, replay the recorded HTTP traffic:
cd "$(cat /tmp/proxymock-postgres-demo.path)/go-postgres"
proxymock replay --test-against http://localhost:8080
The terminal should report five matching HTTP responses, database mock hits and zero database mock misses. The app just worked end to end with PostgreSQL stopped. That is the same setup covered in Mocking PostgreSQL the Easy Way, used here as a starting point rather than the destination.
AI assistant prompt:
Using the newest local proxymock/recorded-* recording, stop the Docker container named proxymock-postgres-howto. Start the proxymock mock server and run this Go app with `PGUSER=postgres proxymock mock -- go run .`. Keep that process alive, replay the recorded inbound HTTP traffic against http://localhost:8080, wait for the replay to finish, and report the response match count plus database mock hits and misses. Do not return while the replay is still running.Flip the recording around
By default, a replay sends inbound traffic to your app as tests. It serves outbound traffic, including every PostgreSQL call, as mocks. To test the database, the PostgreSQL side needs to switch jobs: the recorded queries become the tests, and the database becomes the system under test.
That is what a tests filter does. It chooses which recorded traffic runs as tests. Everything else is mocked. The recording never changes direction; only its role in this replay changes.
flowchart TD
    subgraph D[Default replay]
        D1[Inbound HTTP] -->|test| D2[Your app]
        D2 -->|mocked| D3[PostgreSQL]
    end
    subgraph F[With a tests filter]
        F1[Recorded queries] -->|test| F2[PostgreSQL]
    end
- CLI:
--tests-filter '(direction IS OUT) AND (tech IS Postgres)' - AI assistant: ask for the Postgres traffic to be replayed against the database, or pass the
tests-filterparameter of thereplay_traffictool. - proxymock web: the Tests filter field on the Replay tab.
- Speedscale dashboard: Choose replay tests in a snapshot’s actions menu, then check the database under Outbound dependencies.
If you used the old reverse services snapshot setting, this replaces it. Reverse services flipped every recorded request at once. A tests filter can promote just the database, keep your inbound tests alongside it with (direction IS IN) OR (tech IS Postgres), and leaves the recording as it was captured.
The replay opens its own PostgreSQL sessions and reads credentials where psql does: PGUSER and PGPASSWORD, or ~/.pgpass. It rejects credentials inside the postgres:// address, keeping passwords out of shell history and reports. Before load starts, it connects once to each database. A bad password stops the run immediately instead of failing every statement.
3. Regression test a PostgreSQL migration or upgrade
Stop the mock and app with Ctrl+C. Then restart PostgreSQL and reset the disposable target database. These commands remove any state left by an earlier run, so this step is safe to paste again:
docker start proxymock-postgres-howto
until docker exec proxymock-postgres-howto pg_isready -U postgres >/dev/null 2>&1; do sleep 1; done
docker exec proxymock-postgres-howto dropdb --if-exists -U postgres tasks_db
docker exec proxymock-postgres-howto createdb -U postgres tasks_db
Now replay the recorded queries once:
PGUSER=postgres PGPASSWORD='' proxymock replay \
  --tests-filter '(direction IS OUT) AND (tech IS Postgres)' \
  --test-against postgres://localhost:5432/tasks_db \
  --fail-if 'requests.result-match-pct < 100'
The clean run should execute 12 statements, show that every result matched, and exit with code 0.
Now make a deliberately incompatible schema change and run the exact same test again:
docker exec proxymock-postgres-howto psql -U postgres -d tasks_db \
  -c 'ALTER TABLE users DROP COLUMN department;'

PGUSER=postgres PGPASSWORD='' proxymock replay \
  --tests-filter '(direction IS OUT) AND (tech IS Postgres)' \
  --test-against postgres://localhost:5432/tasks_db \
  --fail-if 'requests.result-match-pct < 100'
This time, statements that use department appear under RESULT MISMATCH. My validated run showed three matching results, nine mismatches, PostgreSQL SQLSTATE 42703, and exit code 1. That failure is the successful test: it caught the incompatible migration. This is a useful CI check before a migration ships, and a sharper signal than watching API tests pass while the database quietly changes underneath them.
AI assistant prompt:
Run the full PostgreSQL regression demo with the newest local proxymock/recorded-* input. Start the Docker container named proxymock-postgres-howto and wait for pg_isready. Drop and recreate tasks_db with docker exec so it is empty. Use the proxymock MCP replay_traffic tool against postgres://localhost:5432/tasks_db with user postgres and an empty password. Select only `(direction IS OUT) AND (tech IS Postgres)` as tests and fail if `requests.result-match-pct < 100`. Wait for the clean replay to finish and report its verdict. Then use docker exec to run `ALTER TABLE users DROP COLUMN department;` and run the same replay again. Wait for it to finish, then report the second verdict and list every mismatched SQL statement with its PostgreSQL error and SQLSTATE. Do not return while either replay is still running.4. Load test PostgreSQL
Reset the disposable database, then run the same queries with 10 sessions for one minute:
docker exec proxymock-postgres-howto dropdb --if-exists -U postgres tasks_db
docker exec proxymock-postgres-howto createdb -U postgres tasks_db

PGUSER=postgres PGPASSWORD='' proxymock replay \
  --tests-filter '(direction IS OUT) AND (tech IS Postgres)' \
  --test-against postgres://localhost:5432/tasks_db \
  --vus 10 --for 1m --load-test
While the load test runs, paste this into another terminal to see the 10 proxymock database sessions:
docker exec proxymock-postgres-howto psql -U postgres -d tasks_db -c \
  "SELECT application_name, state, count(*) FROM pg_stat_activity WHERE application_name = 'speedscale-generator' GROUP BY application_name, state;"
Each virtual user opens a database session and replays the statements in order, so prepared statements carry over as they did in the app. The terminal results break latency percentiles, throughput and failures down by query. They show both failure count and share, so a few failures cannot hide inside a long run.
In my validated run, the recording produced 1,125,393 statements in one minute, or 18,756.37 statements per second, with p99 at 1 ms. Your laptop will produce different numbers. The useful part is that you can tie every number back to a query your app actually sent. For the wider question of whether a slowdown belongs to the database or the API, the same recording drives both sides.
AI assistant prompt:
Run the PostgreSQL load demo with the newest local proxymock/recorded-* input. Start the Docker container named proxymock-postgres-howto if needed, wait for pg_isready, then drop and recreate tasks_db with docker exec. Use the proxymock MCP replay_traffic tool against postgres://localhost:5432/tasks_db with user postgres and an empty password. Set tests-filter to `(direction IS OUT) AND (tech IS Postgres)`, vus to 10, for to `1m`, and load-test to true. Keep the MCP session alive and poll list_running until the replay has finished. Then read the completed process logs and summarize total statements, throughput, p50/p95/p99 latency, failures, failure rate, and results by SQL query. Do not return while the replay is still running.For a one-minute load run, use the CLI if your chatbot does not keep MCP processes alive between turns. A chatbot that exits after saying the run started can also stop the replay early.
5. Review the saved results in proxymock web
Run the web viewer from the demo directory, where the proxymock workspace lives:
cd "$(cat /tmp/proxymock-postgres-demo.path)/go-postgres"
proxymock web --port 7788 --open=false --forwarder-addr ''
Open http://127.0.0.1:7788 and use the RUN dropdown in the upper-left corner:
- Choose the
recorded-*run to show the captured HTTP and PostgreSQL traffic. - Choose the first database
results/replayed-*run to show the clean regression. - Choose the next database
results/replayed-*run to show the broken schema. - Stay in Grid, select a row whose MATCH value is no match, and open Response. You will see
column "department" does not existand SQLSTATE42703. - Use the load-test terminal summary for aggregate throughput and latency. Load mode samples the saved rows, so the Grid does not contain every execution from a million-statement run.
From the Speedscale dashboard
For traffic recorded in Kubernetes, the same test runs from the dashboard. Open the snapshot, choose Choose replay tests, check the database under Outbound dependencies, and save. Speedscale reanalyzes the snapshot, and the database becomes a service you can replay against. Put its credentials in the test config’s generator.postgres section, with the password stored as a secret reference.
Things to know
- Use a disposable database. Replays run real inserts, updates and deletes.
- Row ids come from the recording. Updates and deletes carry the original row ids, so on a fresh copy some of them match nothing, and repeated inserts can hit unique constraints. These are reported as SQL results, not replay failures.
- Transactions are replayed statement by statement. Recorded traffic mixes many app connections, so a replay can send a
COMMITwithout itsBEGIN. proxymock logs a warning when that happens. - Not replayed yet: COPY and function calls.
Proving that PostgreSQL can go fast in the abstract is the easy part. The harder and more useful question is whether your schema survives the statements your app really sends, and how those same statements behave under load. One recording answers both.
The PostgreSQL Load and Regression Testing guide covers the full setup, including credentials in test configs and the dashboard flow.